To download this blog as a pdf click here
Police and Crime Commissioners (PCCs) are elected by the public to hold Chief Constables and the police service to account, effectively making the police answerable to the communities they serve. The upcoming PCC elections on May 6th offer an opportunity to address inconsistency and insufficiency in traffic law enforcement.
The newly elected PCCs are each required to define priorities for their police service in a police and crime plan. Action Vision Zero has partnered with seven other organisations (British Cycling, Cycling UK, Living Streets, Road Danger Reduction Forum, RoadPeace, Sustrans, and 20’s Plenty for Us) on a joint PCC manifesto Commit to Act on Road Danger. Our calls include ensuring the police prioritise those offences which pose harm to others, especially to those more vulnerable (people cycling and walking).
New research by Action Vision Zero, using Home Office data, documents the wide variation between police services in the number of sanctions given by police officers for key traffic offences. To ensure a like for like comparison, the absolute number of sanctions[i] was assessed relative to the number of killed or seriously injured casualties (KSIs)[ii] in each area. This meant that large police services, such as the Metropolitan Police, were not advantaged by virtue of their size.
Analysis
This analysis looks at what Action Vision Zero believes are the four key offences posing harm to others, particularly those walking and cycling. As our analysis focuses on police efforts, it is restricted to offences detected by police officers (as opposed to camera detected):
- Speeding
- Careless driving
- Mobile phone use (hand held)
- Uninsured vehicles.
All offence data is from the Home Office whilst the casualty data is from that published by the Department for Transport.
Caveats
- Officer detected offences were identified as non camera detected for speed limit offences and as driver present for the other offences (Careless driving, Mobile phone use and Uninsured vehicles) , as the Home Office does not provide camera/non camera detection data for these.
- The data is for 2019, the most recent year available. This time period should be seen as a pre-COVID baseline. Data for 2020 will not be published by the Home Office until October 2021.
- With the increased priority for walking and cycling by the UK Government, including the investment in active travel, many police have increased their efforts to reduce road danger.
- The Home Office states that six police services do not provide complete data (Gwent, South Wales, North Wales, Derbyshire, Northamptonshire, and North Yorkshire). No information is given on how incomplete the data is or for which offences. This is not the first year these police services have been reported for not providing complete data.
Other offences?
The analysis does not cover the more serious offences which must be prosecuted at court. These offences, including dangerous driving and drink/drug driving, are not reported by the Home Office but by the Ministry of Justice (MoJ). And the MoJ reports the number of offenders prosecuted at court. And the number prosecuted is not always an accurate indicator of police effort. The police arrest many more suspects for these offences. Not all make it to court. In London, over twice as many drivers are arrested for dangerous driving than later are prosecuted at court for dangerous driving.
Huge range in enforcement activity amongst police forces
Table 1 compares the average of the five police services reporting the highest number of offences per 10 KSI road casualties with the average of the five lowest. This is to avoid being distracted by extreme outliers.
Table 1: Range in officer detected sanctions
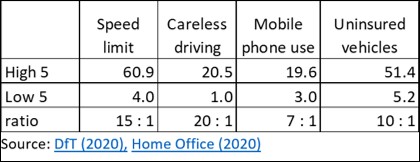
Source: DfT (2020), Home Office (2020)
The greatest variation is seen with careless driving with 20 times as many offences being sanctioned on a per KSI basis in the top five police services compared to the bottom five police services. Officer detected speeding offences comes next with 15 times as many offences detected. See the graphs below for the data on the individual offences and police services. Norfolk and Suffolk have been combined for, as reported by the Home Office, they submit jointly and so cannot be separated out in the Home Office data.
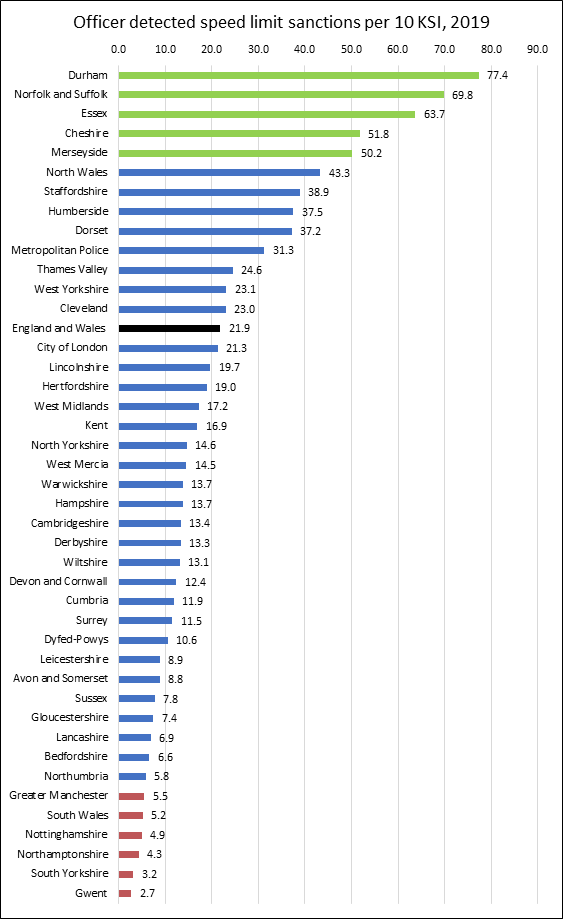
Speeding
Durham reported the highest number of officer-detected speeding offences. In Durham the police use mobile speed cameras, but they do not use fixed speed cameras. So, officer detected speed enforcement can be expected to be a priority for police in Durham.
The average for England and Wales was 21.9. As shown in the graph below, twice as many police services fell below this average than were reported above it. The lowest five included Gwent and Nottinghamshire, police services which do not report all offences to the Home Office. This could affect their reported number of officer-detected speed limit offences.
The Home Office does not report speed limit offences by speed limit. This information is available from Freedom of Information requests, apart from in London which publishes data by borough and speed limit. But the wide range of activity in speed limit enforcement of 20mph limits is well known, and was highlighted by Rod King MBE and founder of 20’s Plenty for Us, in the recent webinar where the Commit to Act manifesto was launched.
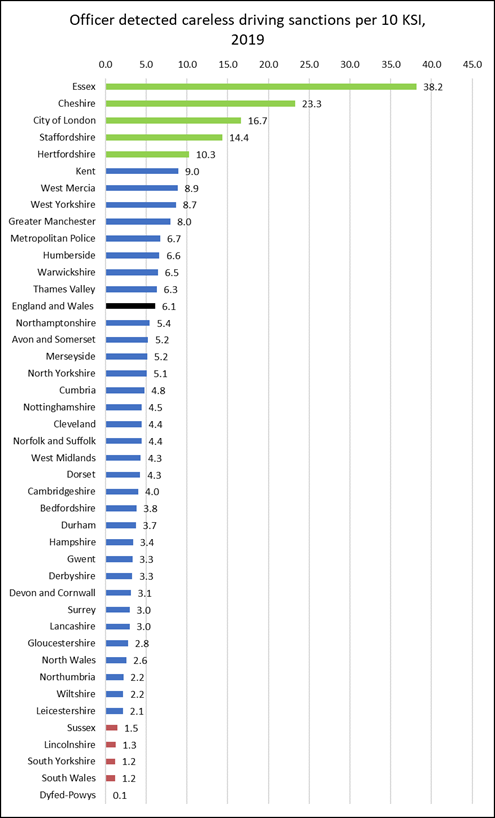
Careless driving
As previously noted, careless driving showed the greatest variation in officer detected enforcement. This ranged from a high of 38.2 in Essex to an extreme low of 0.1 in Dyfed-Powys, the latter reporting only four careless driving offences being detected by officers in the whole of 2019. South Wales was also in the bottom five but this may be due to their incomplete reporting.
Mobile phone
Mobile phone offences detection showed the least variation but there was still seven times as many offences being officer detected in the top five police services compared to the bottom five.
But mobile phone offences have fallen dramatically in recent years, with the uncertainty over the legal status of the charge. Until the legislation is amended, police services may be reluctant to sanction drivers for hand held use of phone.
Uninsured vehicles
Uninsured vehicles have a much higher risk of being involved in a fatal collision. Staffordshire Police officers sanctioned the highest number of uninsured vehicles on a per KSI basis (65.9), with Northumbria (3.2) and South Wales (0.2) reporting the fewest. But as noted before, South Wales does not report all offences to the Home Office and this might include uninsured vehicle offences.

What does good look like?
Whilst no police service was reported in the five highest or five lowest for all four key offences, several police services did stand out. As seen in Table 2, three police services, Cheshire, Essex and Staffordshire, were found to have three of the four key offences in the top five. And two police services, South Yorkshire and Dyfed-Powys, had three offences in the lowest five.
By police region, Table 2 shows three regions (West Midlands, East and London) had police services included in the five highest, whilst the South East region and Wales only had examples of the five lowest.
This analysis compares the range/variation in enforcement between police services and police regions. But it does not mean that any police service is doing enough. As shown in Appendix 1, in 2019, just one third of police services (13) report officers sanctioning more than one careless driver a day.
Our coalition is asking what is good practice in roads policing? As noted above, we know it is not solely the number of motoring offences sanctioned. Enforcement hours would be a good indicator, but this data is not published.
We do think that good practice involves transparency with more openness about what enforcement is taking place. Our Commit to Act on Road Danger manifesto calls for greater transparency and accountability, with more up to date data on enforcement, strategies and performance indicators published. We want to know not only what the police are doing but if they think they are doing a good job.
We are trying to get best practice standards agreed, starting in the areas dependent on community engagement such as third-party reporting, community speedwatch and close pass operations. These are more process indicators but would be under police control, unlike compliance indicators.
How to help and get involved?
Take action and canvas your PCC candidate. Use the checklist our coalition has produced.
Ask if they know which offences and how many are being sanctioned by police officers.
They should now be aware as Action Vision Zero will be emailing this analysis to all known PCC candidates.
Ask how they will reduce road danger and if they will commit to adopting our calls.
Let us (Amy@ActionVisionZero.org) know their response as we are keen to collate and share this information.
Table 2 Officer detected key motoring offences per 10 KSIs, England and Wales (2019)

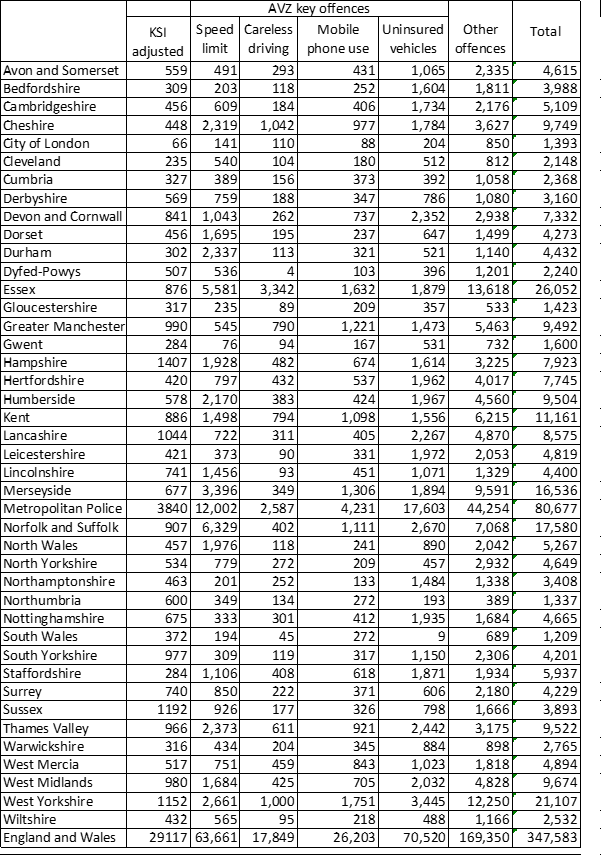
Appendix 1: Reported KSI and officer detected motoring offences, England and Wales (2019)
[i] Excluding those offences which the Home Office reported as cancelled.
[ii] Adjusted Killed and Seriously Injured casualty figures, produced by the Department for Transport for each police service area, have been used. These are adjusted to ensure more accurate reporting of serious injuries, with some police services mis-recording these as slight injuries.

One Reply to “”