February 2025
To download this briefing as a pdf click here
The tables (Excel file) linked to this briefing can be viewed here
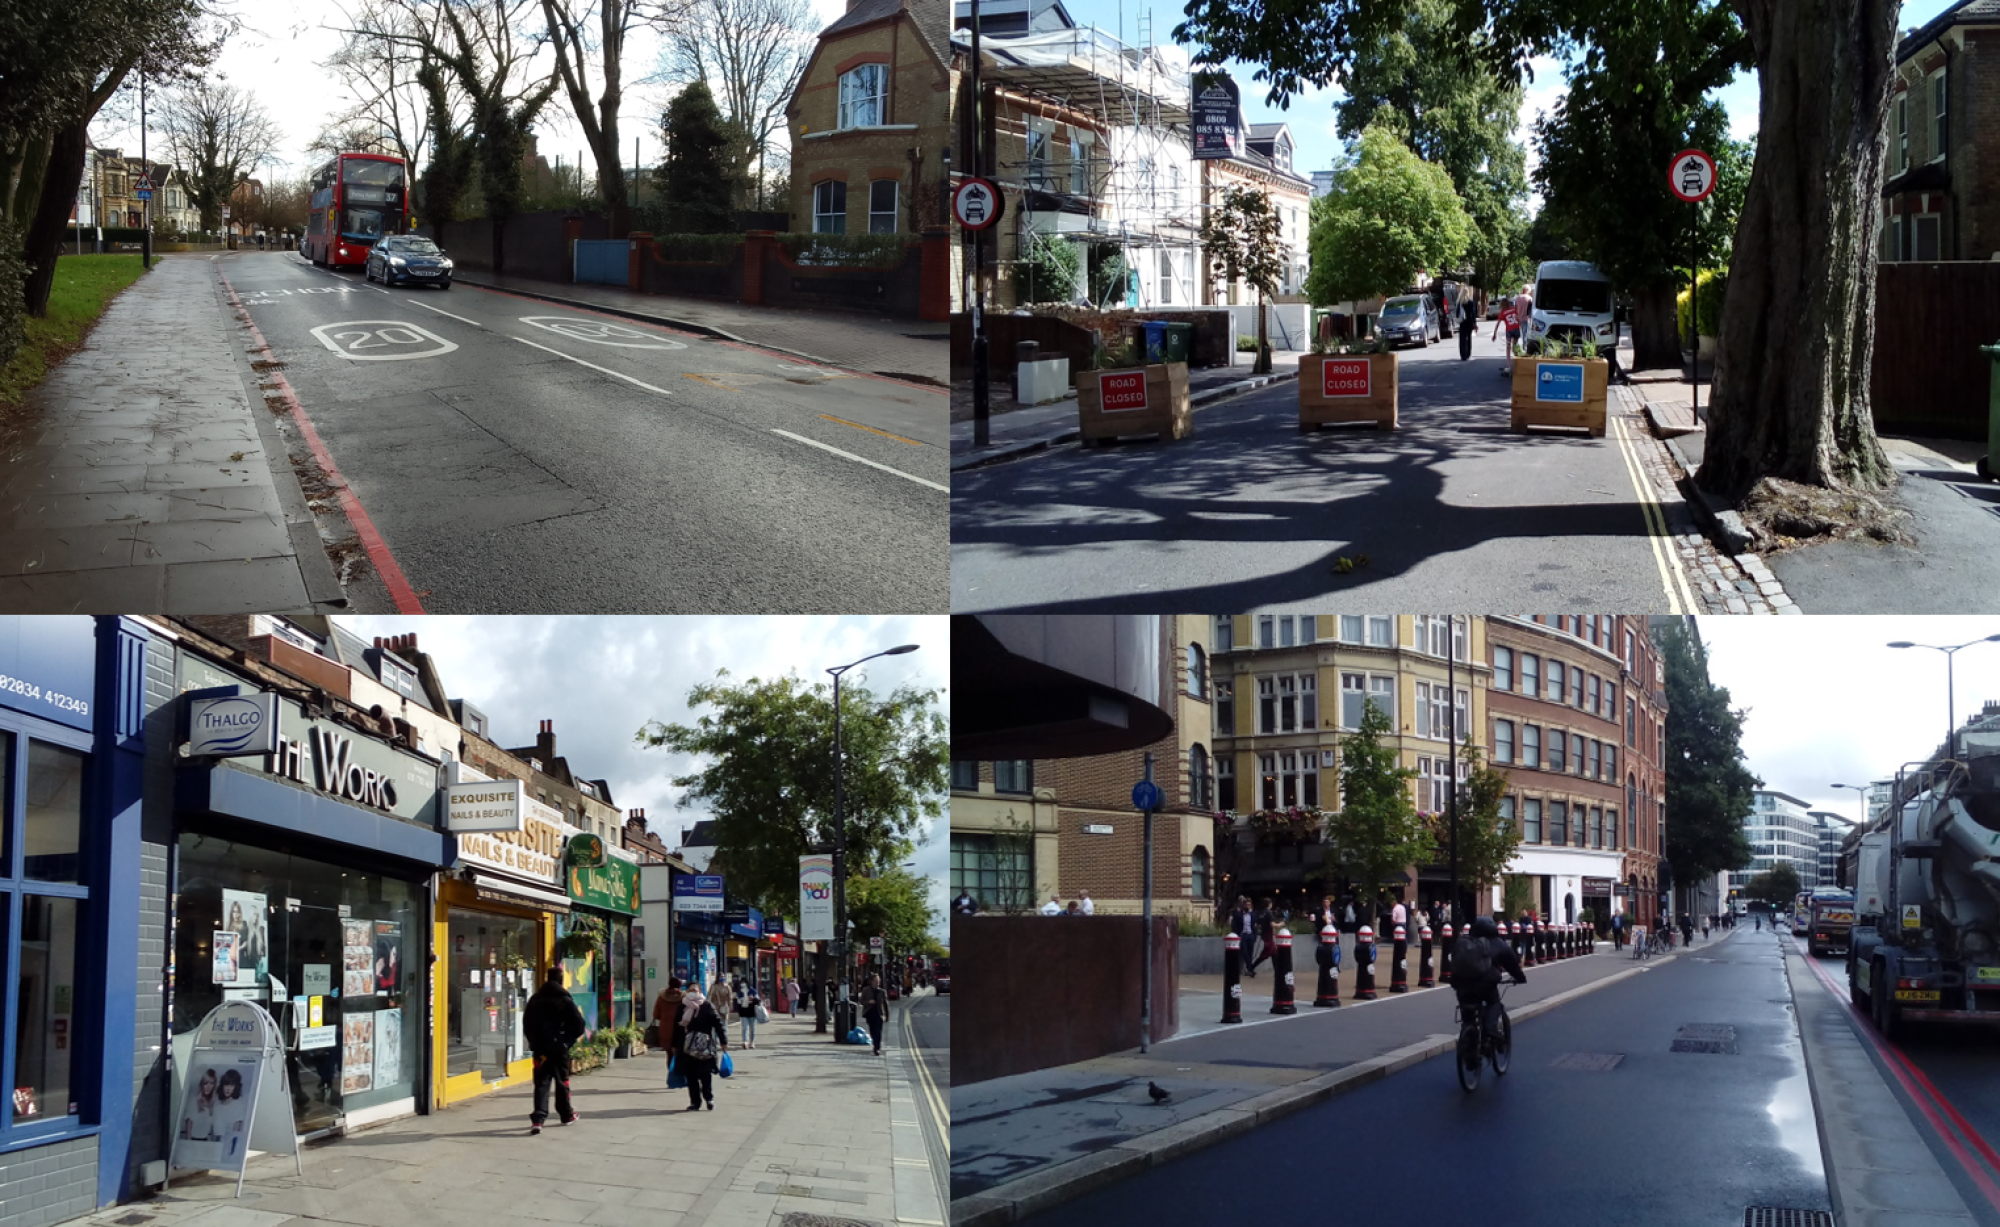
Speed enforcement has greatly increased in London in recent years but is it happening on the right roads?
AVZ has analysed the statistics on London speeding offences and summarised them in a new briefing. This is based on data from the Home Office, Ministry of Justice and Transport for London (TfL). We also compared speed enforcement to where Killed and Serious Injuries (KSIs) were occurring. The briefing also highlights how rare it was for a speeding conviction at court to result in a driving ban.
Key findings
- Speed enforcement in London has increased significantly since 2018 (up 319% from 92,305 sanctioned and convicted offences in 2018 to 386,595 in 2023), with most of the increase occurring by 2022.
- Almost all speed enforcement is by camera (97%).
- Much of the enforcement now occurs on 20 mph and 30mph roads (56%) but this proportion is far lower than the share of the serious and fatal road casualties (KSIs) that occur on these roads in London (93%).
- Reducing the impact of the increase in enforcement is the fact that cancellations of speeding offences increased to 47% in 2023.
- Almost all speeding offences result in a financial penalty, e.g. FPN, NDORS or court imposed fine, with additional money raised from the Victim Surcharge on offences convicted at court (40% of fine).
- Very few speeding offences result in a driving ban (1.3% of those convicted at court).
- Speed enforcement accounts for the vast majority of the traffic law enforcement that occurs in London (72%).
- AVZ conclusion: Even more speed enforcement is needed, especially on 20 and 30 mph roads. And the problems with cancellations must be corrected. The one million speeding offences target should mean one million speeding offences are sanctioned, not just started.
AVZ will also be publishing more on speed enforcement, including where we compare police services on their speed limit offences per KSI. This is expected to show even more speed enforcement is needed in London in order to be a leading performer in England and Wales.
Introduction
Reducing vehicle speed is key to increasing levels of walking and cycling as well as reducing road deaths and serious injuries. Where compliance with the speed limits by drivers is lacking, enforcement is needed.
This briefing refers to London and summarises the speed enforcement by the Metropolitan Police Service (Met). It does not include the speeding offences detected by the City of London Police, apart from court convictions which are reported for London as a whole. Data is from the Home Office (HO), the Ministry of Justice (MoJ) and the London Vision Zero Enforcement Dashboard (LVZED) which is produced by Transport for London (TfL). Data tables are provided in the AVZ London Speed enforcement briefing spreadsheet with findings referenced in this briefing.
- Speed enforcement – How many offences?
In 2023, the number of speed limit offences sanctioned in London rose to 386,595 (HO and MoJ), up 319% from 2018 (Table 1). When the London Vision Zero Action Plan was launched in 2018, the levels of speed enforcement by the Met were very low. Most of the increase in enforcement in London occurred prior to 2022, with only a 7% increase between 2022 and 2023. In 2023, speed limit offences accounted for 72% of the total of 538,267 motoring offences in London. Its share has increased significantly since 2018 when it was 43%.
To clarify, the 386,595 speed limit offences refers to those sanctioned out of court or at court, and not the number of speeding offences detected (this is a much larger figure). Nor does it include those cancelled or the few prosecutions which resulted in a not guilty finding. It does not include the number of letters sent out (14,423) from the Community Road Watch (CRW) programme, which detected 20,605 vehicles speeding in 2023 (Table 2). (Excluding the period of the pandemic) CRW has decreased since 2018. And it does not include the speed limit offences detected by the Wandsworth Council short-lived pilot speed camera scheme.
Cancellations. In 2023, almost half (47%) of speed limit offences reported in London were cancelled (Table 3). This was 348,159 offences The cancellation rate was already high in London, averaging 32% and had increased to 36% in 2022 before rising to 47% in 2023. This was more than twice the national rate of 22%. The London Vision Zero Action Plan Progress Report[1] included a target of one million speeding offences by 2024/25. This target included those offences that were cancelled.
Detection method. The Home Office reported the vast majority of speed offences in London were detected by camera (97%) (Table 4). As could be expected, this share has increased with the rise in the number of speeding offences detected.
2. Where sanctioned and where needed (by speed limit)
Borough. Speed enforcement data is not yet available by borough. This was to be included when the London Vision Zero Enforcement Dashboard (LVZED)[2] launched in April 2023 and has been promised ever since but this has not yet occurred. Given the vast majority of enforcement is by cameras, most of which are fixed, this information should be readily available.
Speed limit. According to the LVZED, in 2023, 33% of speed enforcement was on 20mph roads with a total of 56% on 20 and 30 mph roads (Table 5). This was down from 2022 when 35% was on 20 mph roads and 62% on 20 and 30 mph roads.
Whilst this may seem high (especially when so few police services enforce on 20mph speed limit roads), it is not the best use of speed enforcement when viewed in relation to where people are being killed and seriously injured (KSIs). In 2023, 53% of serious and fatal casualties (KSIs) across London occurred on 20mph roads and 93% were on 20 and 30 mph roads (Table 6). If speed enforcement was proportionate to KSI share, there would be significantly more enforcement on 20 and 30 mph roads in London. Enforcement is particularly needed on 20 and 30mph roads as these are where most walking and cycling occurs and thus where active road users are most intimidated by speeding vehicles.
3. Speed enforcement offences – Outcomes
Out of court convictions. The vast majority of speed offences are sanctioned out of court (91%) and are reported by the Home Office. Of those, 10% are referred for court prosecution, 30% for a Fixed Penalty Notice (FPN) and 60% are sent on a National Driver Offender Retraining (NDORS) scheme (Table 3). The Met receives a portion of the NDORS fee, but all revenue from FPNs go directly to the Treasury. The cost of a speeding FPN is £100 and this sum has not been increased since 2016. Police and Crime Commissioners have campaigned for it to be increased to be in line with that of mobile phone offences (£200).
Court convictions outcome. At court in London (2023), 62% of drivers charged with speeding offences plead guilty, another 2% plead not guilty but there was also 36% with an unknown plea (Table 7).
Fine. At court, the average fine for speeding in London in 2023 was £225, down from £265 in 2018 (Table 8). The victim surcharge imposed on court convictions is 40% of the court fine. Over £3.2m would have been raised from the victim surcharge imposed on speeding fines in London in 2023, if all were paid.
Bans. In 2023, 2,421 bans were given for “totting up”, i.e. drivers whose speeding offence meant they had reached or exceeded 12 penalty points (Table 9). Apart from the totting up cases, only 427 drivers were banned for speeding, just 1.3% of those convicted at court for speeding. This has decreased from 3% in 2018 and is low in comparison to other police services (Table 9). The national average is 1.6%, with 2% in Manchester and 2.4% in the West Midlands. The highest is in Wiltshire (10%) and Northamptonshire (6.8%) (Table 10).
[1] https://content.tfl.gov.uk/vision-zero-action-plan-progress-report-2021.pdf
[2] https://app.powerbi.com/view?r=eyJrIjoiMTMxMWM1ZjYtNTIxYy00OGQzLWFjYzItMmMyN2I3MzQ0YjQzIiwidCI6IjFmYmQ2NWJmLTVkZWYtNGVlYS1hNjkyLWEwODljMjU1MzQ2YiIsImMiOjh9
